Running the people function as a strategic business organization

What one general manager actually wants from HR

The short version

The People function has customers, meaning employees and candidates, and a product, meaning their experience across the whole lifecycle, and it should ladder to one business number: human capital return on investment (HCROI), a required disclosure for organizations reporting under ISO 30414, which compares what the workforce produces against what it costs. Two branches move that number. Talent Growth covers attract, hire, and ramp, with quality of hire as the centerpiece. Talent Compounding covers retain, engage, and develop, anchored by team-level engagement, a rating curve that really moves, and a behavior gate built on humble, hungry, and people-smart, where strong output can't buy back a real miss. A foundation of rewards, service, efficiency, and risk carries the cost side. Three rules keep it working: the dashboard stays diagnostic and off comp, every metric is reported alongside its counter-metric, and leading metrics run monthly while lagging ones run quarterly. Start with Finance on the HCROI definition, then the plumbing, then quality of hire. The rest of the article is the reasoning, the evidence, and the objections.

I run a business unit, with revenue, margin, and a profit and loss statement I answer for every quarter. For years the hardest function for me to evaluate wasn't Engineering or Marketing; it was People. The work clearly mattered. But the scoreboard never connected to anything I ran the business on: engagement was up, attrition was fine, the surveys were green, and still the results weren't there. My best people were quietly burning out carrying everyone else, and nobody could tell me whether the function was making the company better or just busier.

I don't blame HR for that. The measurement was broken, and business leaders like me helped break it by never saying clearly what we wanted. This article is my attempt to say it clearly, drawing on a career at firms from Google and Electronic Arts to Groupon and Coursera, and in the U.S. Navy before that. I think of the People function as a strategic partner to the business rather than a cost center, and what follows is the operating model that makes it easier to understand how it works that way: a key performance indicator (KPI) tree, grounded in the best evidence I could find. If you lead a People function, consider this one general manager's answer to a question you should be asking us more often: what does the business actually want from me?

The People function has customers and a product

Every function I run ladders to the customer. Product turns user experience into recurring revenue. Marketing turns attention into pipeline. The People function fits the same shape. Its customers are current employees, plus the people you're trying to hire. Their experience across the whole lifecycle, from the first job posting they read to the day they leave, is the product. And the logic of the function fits in one sentence: great experience produces great people, and great people make the business better.

It means the function ladders to a business number the same way Product ladders to annual recurring revenue (ARR).

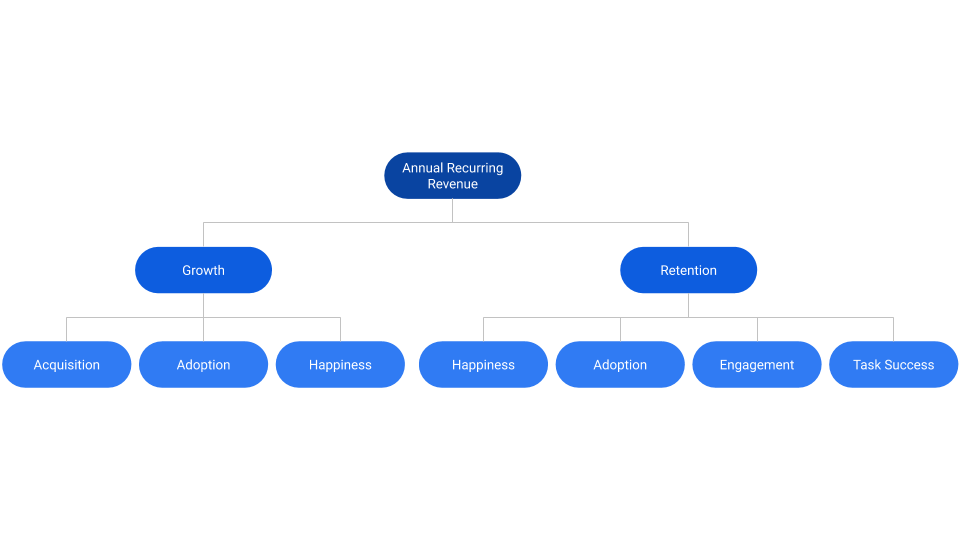
The tree ladders to one number: Human Capital ROI

Figure 1: People Function KPI Tree

Let’s get real nerdy for a moment. ISO 30414:2025, the international standard for human capital reporting, defines 69 metrics across 11 areas of workforce measurement, and human capital return on investment (HCROI) is one of its required metrics. The formula for it is:

HCROI = [Total revenue − (Total expenses − Total workforce cost)] ÷ Total workforce cost − 1

The formula expresses how much value comes back for every dollar invested in people, beyond the dollar itself. Workforce costs typically run between 25% and 60% of operating expenses. That makes it the largest controllable investment most companies have, and I'd argue the least instrumented one.

I like this apex for a reason beyond the fact that a standards body did the arguing for me: it's self-balancing. Every feel-good People metric I'd been handed over the years could be improved by overpaying and asking less. Pay top of market while lowering the bar, and retention climbs, engagement climbs, and the economics quietly erode underneath. HCROI resists that. Overpaying swells the denominator, cutting too deep collapses the numerator, and what's left is the exact tension a business leader wants managed: talent quality against talent cost, held in one number.

The claim is easier to trust after working the arithmetic once. Consider a small software firm with $1 million in revenue, $750,000 in total expenses, and $500,000 of that sitting in workforce cost: salaries, benefits, contractors, and yes, the People function's own budget. The bracketed part of the formula nets out every expense except people, so the calculation reads as revenue minus non-people cost, divided by people cost: ($1M − $250K) ÷ $500K − 1 = 0.50. Every dollar invested in people returns $1.50, or 50 cents beyond the dollar.

Now run the same firm forward two ways. If it invests $100,000 in senior hiring and development, and the stronger team lifts revenue to $1.3 million on flat non-people cost, HCROI rises to ($1.3M − $250K) ÷ $600K − 1 = 0.75. Workforce cost went up; the return went up faster. That's what a sound talent investment looks like in this arithmetic. If the firm instead cuts $100,000 of people cost while revenue holds for a year, HCROI jumps to ($1M − $250K) ÷ $400K − 1 = 0.875, briefly the best number of the three. The following year the lost capability surfaces, revenue slips to $800,000, and HCROI lands at ($800K − $250K) ÷ $400K − 1 = 0.375, below where the firm started. In other words, a cut flatters the ratio only until the numerator catches up. This is why the metric is never used alone.

One caveat, the same one I'd give a product leader about ARR: the People function influences HCROI without solely owning it. Pricing moves it, product moves it, markets move it. That's fine. Partial ownership of the right number beats full ownership of a number that connects to nothing.

Underneath the apex, value grows through two mechanisms: bringing great people in, and compounding the ones you have. Both sit on a foundation. Figure 1 shows the whole tree at a glance, and the next three sections walk through it.

Talent Growth: how great people come in

Figure 2: Talent Growth

The front half of the lifecycle covers attract, hire, and ramp. Future employees are customers you haven't closed yet, and a strategic partner grows the customer base as deliberately as it serves the current one. To map the signals I borrow the happiness, engagement, adoption, retention, and task success (HEART) framework, which I've written about previously and which Google researchers introduced in 2010 to measure user experience at scale (Rodden, Hutchinson, & Fu, 2010). What I use most is its goal-signal-metric chain, a discipline that forces one question for every number: what goal is this evidence of? Plenty of familiar HR numbers can't answer it. The three below can, and Figure 2 shows the branch in detail.

Quality of hire is the centerpiece. LinkedIn's recruiting research has ranked it the single most valuable hiring KPI for years, and fewer than 40% of organizations track it consistently. Both facts are telling: it matters, and it's hard. The workable construction is a composite of new-hire performance at six to twelve months, first-year retention, and hiring manager satisfaction around day 90. The composite is imperfect, but it serves. The math isn't the hard part; the plumbing is, since it means joining recruiting data to performance data. I recommend building it anyway. It's the only number that tells you whether hiring is raising your talent density or diluting it, and every efficiency metric you already track is silent on that question.

Time-to-productivity is the adoption signal. I measure days from start to full contribution, with the bar defined per role family before the hire starts. Defined afterward, the bar has a way of drifting to wherever the new hire happens to be. Once you measure this, onboarding stops being a checklist someone completes and becomes an outcome someone owns.

Offer-accept rate and candidate experience are the happiness signals. Offer-accept is the cleanest conversion metric available on customers you haven't won yet. Candidate Net Promoter Score (NPS), the familiar would-you-recommend measure applied to your hiring funnel, tells you whether the process builds the employer brand or burns it. I make a point of surveying the people we rejected; they're the larger group, and in my experience the more candid one.

Two metrics are missing from this branch by design: time to fill and cost per hire. They measure efficiency rather than quality, so they live down in the foundation. A recruiting function optimized on speed and cost alone fills seats without filling capability. I've watched it happen.

Talent Compounding: how the people you have get more valuable
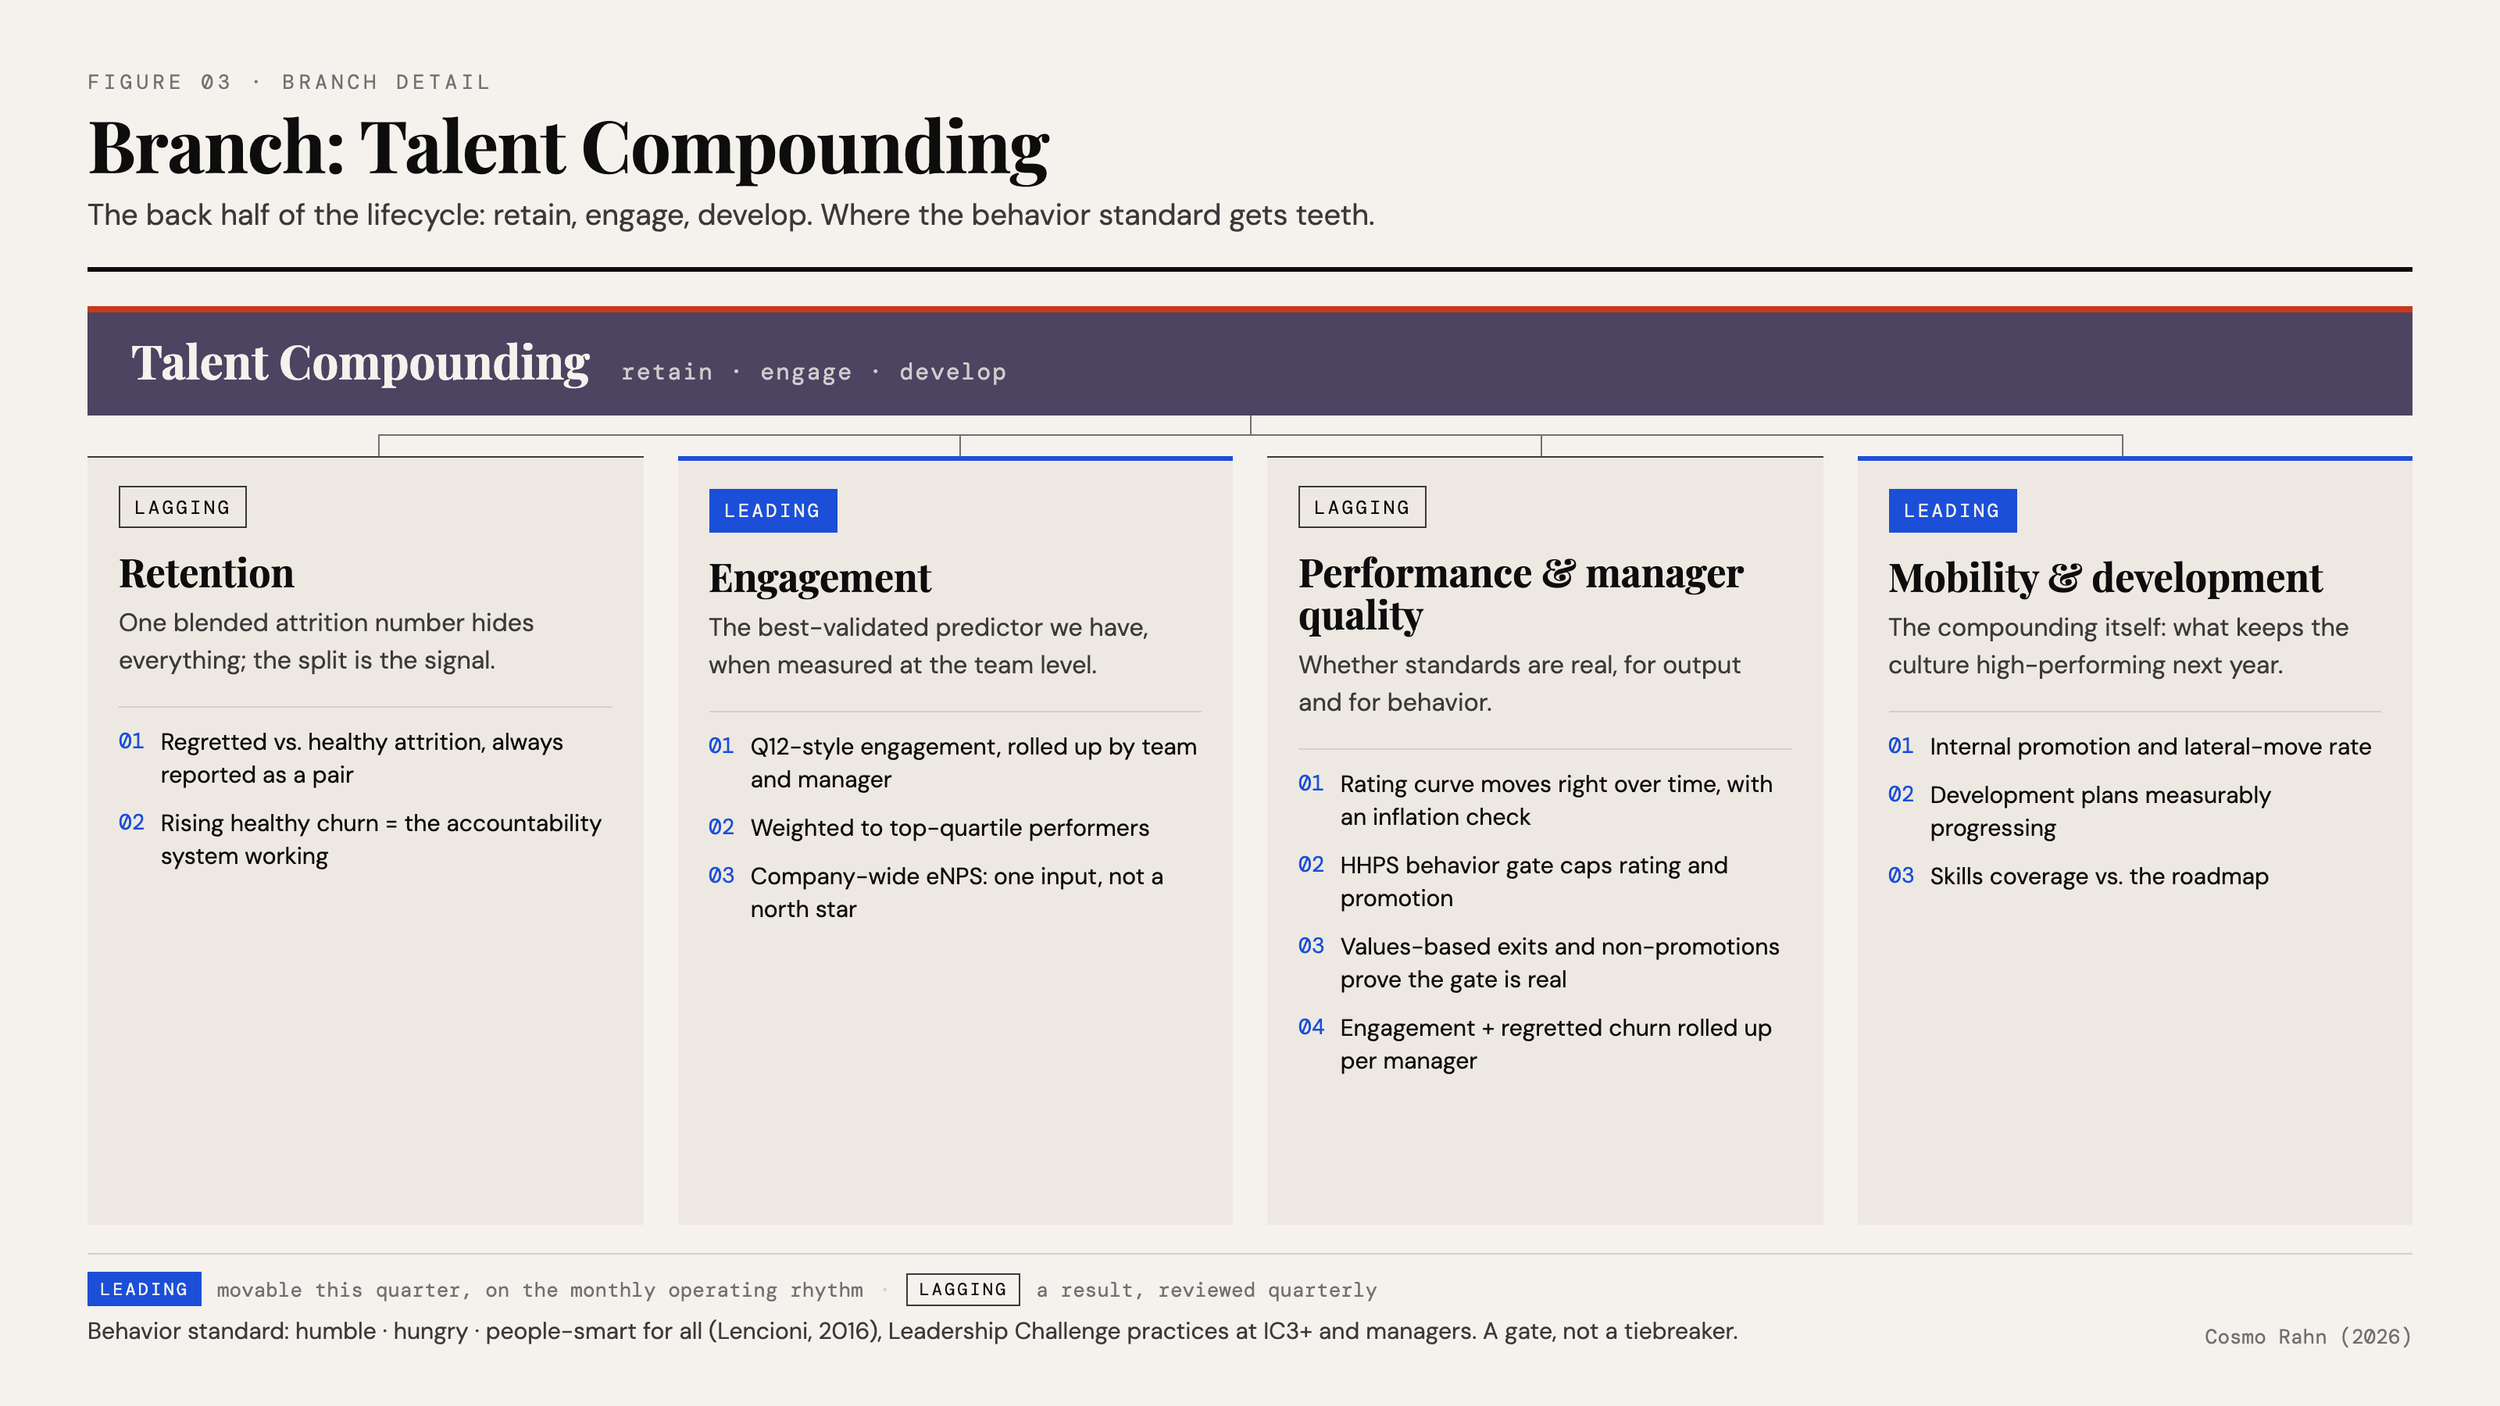
Figure 3: Talent Compounding

The back half covers retain, engage, and develop. Most culture measurement already lives here, so the work is less about adding metrics and more about fixing the ones you have. There are four signals, laid out in Figure 3.

Retention, split into regretted and healthy. I report the two together, always as a pair. Losing someone you fought to keep is a loss; exiting someone below the bar is the system working. One blended attrition number hides both, and it sets a trap for later. The quarter you finally get serious about accountability, healthy attrition rises, and the blended number makes a functioning system look like a retention crisis that someone will then panic and reverse.

Engagement, measured at the team level and weighted toward your best people. I came into this skeptical of engagement scores. They seemed too easy to campaign for and too loosely tied to output, and the evidence changed my mind with one large condition attached. Gallup's Q12 is a twelve-question engagement survey, one of the most studied instruments in the field. The eleventh edition of their meta-analysis, combining results across 347 organizations and more than 180,000 teams, finds a true-score correlation of 0.49 between team engagement and composite performance, with top-half teams roughly doubling their odds of success against bottom-half teams (Gallup, 2024). Evidence in organizational research rarely gets stronger than that. I don't intend to wade into the politics of survey vendors here; any validated instrument that gives you a team-level read works, and Gallup's simply has the deepest evidence base. The signal lives at the team level, rolled up by manager, with a reporting floor so results from very small teams stay anonymous. A healthy company average can hide two struggling high-performing teams, and for the same reason I treat a company-wide employee Net Promoter Score (eNPS) as one input rather than a headline number.

Performance and manager quality, tracked together. On the performance side, I watch whether the rating distribution actually moves right over time, with an inflation check alongside it. A company where 85% of people exceed expectations has a broken system, and everything downstream of it is contaminated. On the manager side, I roll engagement and regretted attrition up per manager, because people leave managers more often than they leave companies, and the Gallup evidence above is largely evidence about what managers do. Google reached the same conclusion from the opposite direction. Project Oxygen began in 2008 as an attempt by a company skeptical of management to test whether managers mattered at all, and the data ended the debate: teams with the most effective managers performed better, stayed longer, and were happier. The behaviors that made those managers effective proved learnable, and technical expertise ranked last among them (Garvin, 2013). The broader lesson sits under every branch of this tree. The People function designs and instruments the system; management makes it happen. Every metric here moves, or doesn't, through a manager's daily decisions. That's why manager quality gets its own signal instead of hiding inside an average.

This branch is also where behavioral standards get teeth, and I'll share how we did it. In his 2016 book The Ideal Team Player, Patrick Lencioni distills what makes someone worth building a team around into three virtues: humble, hungry, and people-smart (HHPS; Lencioni, 2016). Well, Lencioni uses ‘Smart,’ but I prefer the more specific people-smart to differentiate from intelligence. We assess everyone against those three. For senior individual contributors and managers, we layer on the leadership practices Jim Kouzes and Barry Posner documented in The Leadership Challenge, applied at the role level. The key design decision is that behavior operates as a gate rather than a tiebreaker: a real miss on any virtue caps the rating, no matter how strong the output. A tiebreaker leaves your highest-output, lowest-behavior people exactly where they are, since their numbers still carry them. A gate is the only version your best people will believe. A mistake I have made along the way is focusing on results without first taking a team through the stages of team development, and the behavior standard exists partly so the results conversation and the team conversation happen together. The metric that proves the gate is real is values-based exits and non-promotions. The day that number moves off zero is the day the standard moves from aspiration to practice.

Mobility and development, the compounding itself. Here I track internal promotion and mobility rates, development plans that measurably progress rather than merely exist, and skills coverage against where the roadmap is heading. This is what keeps a high-performing culture high-performing next year, not just this quarter.

The foundation: what both branches run on

Figure 4: The Foundation

The foundation holds four deliberately unglamorous cells, shown in Figure 4 with the apex formula underneath. Rewards covers comp competitiveness by level and pay equity, checked annually; the whole tree sits on paying fairly against market. Service delivery is the People team's own product quality: employee satisfaction with HR services and time-to-resolve, measured the way any support function measures itself. Efficiency holds people cost as a percent of revenue, cost per hire, and revenue per full-time equivalent (FTE), the productivity companion to HCROI. Risk means compliance, plus a standard I state to my own team in two words: no surprises.

The foundation carries the cost denominator for the whole tree. If your company ever reports human capital externally, this is also where the ISO-required disclosures mostly live. Its lack of glamour is the point.

Three operating rules: keep it diagnostic, pair every metric, split the cadence

Metrics rarely fail on selection; they fail on operation. I run this tree under three rules, each one closing a failure mode I've watched happen.

The first keeps the dashboard diagnostic: off comp, off individual incentives. The moment any of these numbers pays someone, it gets gamed. A manager comped on retention will hoard an underperformer to protect the number. A team comped on engagement will campaign for survey scores every quarter. We pay people on business results and diagnose with this.

The second pairs every metric with its counter-metric: retention with regretted attrition, engagement with performance movement, hiring speed with quality of hire, cost with capability. Paired up, no single number can be improved without its partner exposing the trade. Any review that shows one without the other is incomplete by definition.

The third runs leading metrics monthly and lagging ones quarterly. Offer-accept, time-to-productivity, low-performer actioning, and development progress all move inside a quarter; they belong on the operating rhythm. HCROI, quality of hire, regretted attrition, and promotion rate confirm whether the leading work compounded. A dashboard built entirely on lagging indicators is driving by the rear-view mirror.

Five objections, answered

An argument this confident deserves pushback, so here is the pushback I would give it myself, and where each objection lands.

"HCROI just hands the CFO a cost-cutting argument." It can, if it's used alone. Cutting workforce cost improves the ratio this quarter, and the value destruction shows up in next year's numerator, after the people who carried it are gone. The arithmetic from the worked example applies here: 0.875 for a year, then 0.375. That lag is why the counter-metric rule exists. HCROI never appears without quality of hire, regretted attrition, and top-performer engagement beside it, and a cost cut that improves the ratio while those three degrade is a loan against next year's numerator, not efficiency. The tree makes the loan visible.

"You're reducing people to numbers." The alternative to measurement is politics rather than humanity. In an unmeasured People function the loudest manager wins calibration, the burnout of your most conscientious people stays invisible, and the toxic high performer keeps getting promoted because nobody can prove the damage. Every metric on this tree exists to protect someone. Regretted attrition protects the people worth fighting for; the behavior gate protects teams from toxic producers; team-level engagement finds the struggling groups a healthy average hides. Measurement is how care scales past the number of people one leader can personally watch.

"Correlation isn't causation. Maybe winning teams just feel more engaged." Partly true. It has also been tested directly: a longitudinal study of 2,178 business units across 10 organizations found employee perceptions drive bottom-line outcomes, with the reverse effect present but weaker (Harter et al., 2010). Even so, I don't need to win that argument. A diagnostic requires signal, not proven causation. When a high-performing team's engagement drops, something changed, and I want to know before the performance follows. That is the entire job of a leading indicator.

"The behavior gate is subjective. You've built a bias vector with a virtuous name." Of the five, this is the objection I take most seriously; "culture fit" has an ugly history of meaning "people like us." Three safeguards keep the gate from becoming that. The virtues carry written, per-level behavioral anchors, so a miss on humble means observable actions rather than a manager's impression. Behavior ratings get calibrated across managers in the same session where output ratings get argued. And the gate's own metric, values-based exits and non-promotions, gets reviewed for patterns: a gate that only ever fires on one demographic is broken and gets treated that way. A standard with anchors, calibration, and pattern review is far safer than the actual alternative, which is the same judgments happening anyway, undocumented, in promotion rooms.

"If nobody's paid on these numbers, why would anyone move them?" Managers are paid on the business results these numbers predict. The tree is the instrument panel; consequence lives in performance management, where it already belongs. Keeping the layers separate preserves the integrity of the numbers. Collapsing them buys you survey campaigning and hoarded underperformers, and both cost more than any incentive gap.

Where to start: Finance first, then the plumbing, then quality of hire

The sequence that's worked for me starts with Finance: settle the HCROI definition first, because what counts as workforce cost determines what the whole tree ladders to. Then stand up the cheap, high-signal splits, such as regretted versus healthy attrition and engagement rolled up by team; these are mostly plumbing in systems you already own. The quality-of-hire pipeline comes third, and I'd start it knowing it won't report cleanly for two quarters. It's the hardest build and the highest-value box on the tree. Targets come last, after baselines, because a target set before a baseline is fiction.

Within a quarter, you and your business leadership can look at this tree together and know, not feel, whether the People function is making the workforce more valuable than it costs.

This is what I'm looking for because it's how I understand great People teams. They measure themselves like a strategic business partner. The tree is what that looks like in practice.

References

Gallup. (2024). The relationship between engagement at work and organizational outcomes: Q12 meta-analysis (11th ed.). Gallup, Inc.

Garvin, D. A. (2013). How Google sold its engineers on management. Harvard Business Review, 91(12).

Harter, J. K., Schmidt, F. L., Asplund, J. W., Killham, E. A., & Agrawal, S. (2010). Causal impact of employee work perceptions on the bottom line of organizations. Perspectives on Psychological Science, 5(4), 378–389.

International Organization for Standardization. (2025). Human resource management — Requirements and recommendations for human capital reporting and disclosure (ISO Standard No. 30414:2025).

Kouzes, J. M., & Posner, B. Z. (2023). The leadership challenge: How to make extraordinary things happen in organizations (7th ed.). Jossey-Bass.

Lencioni, P. (2016). The ideal team player: How to recognize and cultivate the three essential virtues. Jossey-Bass.

Rodden, K., Hutchinson, H., & Fu, X. (2010). Measuring the user experience on a large scale: User-centered metrics for web applications. Proceedings of the SIGCHI Conference on Human Factors in Computing Systems, 2395–2398.

Conclusion: Navigating AI Adoption for an Inclusive Future

The integration of artificial intelligence into our lives represents one of the most significant technological shifts of our time, comparable to the adoption of personal computing and the internet. However, with this transformation comes a critical challenge: ensuring that AI adoption is equitable, inclusive, and beneficial for everyone, not just a select few.

Understanding AI Adoption: The Factors at Play

AI adoption is shaped by a variety of factors, both psychological and structural. Throughout this series, we've explored how cognitive and emotional aspects influence individual engagement with AI. Cognitive styles, such as exploratory learning and the need for cognition, significantly determine how people interact with and adopt new technologies. Individuals with a high need for cognition are more likely to embrace AI, driven by curiosity and the desire to explore its complexities. In contrast, those with a lower need for cognition may need additional support to feel comfortable engaging with these technologies.

On a broader level, technology adoption is also driven by structural factors, including access to infrastructure, digital literacy, and societal readiness. The Diffusion of Innovations theory helps us understand how innovations spread through societies, highlighting the roles of early adopters, the early majority, and laggards. It is vital to consider how AI can be made accessible to all segments of society—not just to the innovators and early adopters but also those who might need more time and support to feel comfortable integrating AI into their lives.

Ethical and Societal Considerations

The adoption of AI brings with it ethical questions. Privacy, algorithmic bias, and human autonomy are central to the debate on responsible AI use. We must ensure that AI technologies are designed and deployed in ways that respect human rights and dignity, minimizing potential harm while maximizing societal benefit. Addressing these ethical considerations is not just a technical challenge but a moral imperative that requires ongoing dialogue and involvement from various stakeholders—including developers, policymakers, educators, and community leaders.

Another major challenge is addressing the inequalities that AI adoption might create or exacerbate. The digital divide, which emerged with the adoption of personal computing and the internet, serves as a reminder of the disparities arising from uneven access to technology. To ensure that AI is a force for good, we need to invest in infrastructure, provide accessible education, and ensure that marginalized communities are not left behind. Educators, in particular, are critical in helping students understand and engage with AI, fostering a new generation of learners prepared to navigate an AI-driven world.

Applications of AI Today: A Window into the Breadth of AI Implementation

While much of this series has focused on conversational AI platforms like ChatGPT, it is important to recognize the vast array of applications in which AI is transforming industries and everyday life. AI is not limited to virtual assistants and chatbots; it is making significant contributions across various domains, enhancing processes, improving decision-making, and driving innovation. Here are a few key areas where AI is making an impact today:

  • Process Improvement and Automation: AI is widely used to streamline business processes, automate repetitive tasks, and improve efficiency. From manufacturing to customer service, AI-powered automation reduces costs and increases productivity by taking over routine tasks, allowing human workers to focus on more strategic and creative activities.

  • Medical Applications: In healthcare, AI is revolutionizing diagnostics, personalized treatment plans, and medical research. Machine learning algorithms can analyze medical images with remarkable accuracy, aiding in the early detection of diseases like cancer. AI is also being used to predict patient outcomes, optimize hospital operations, and support drug discovery, accelerating the development of new treatments.

  • Research and Development: AI is transforming the research landscape across disciplines. In fields like chemistry, biology, and physics, AI models complex systems, simulates experiments, and analyzes massive datasets. Researchers are leveraging AI to uncover patterns and insights that would be impossible to detect manually, pushing the boundaries of human knowledge.

  • Natural Language Processing (NLP): Beyond conversational AI, NLP is used to analyze text data, summarize information, and facilitate language translation. Applications such as sentiment analysis help organizations understand public opinion, while advanced translation tools break down language barriers and foster global communication.

  • Financial Services: AI plays a critical role in finance, from detecting fraudulent transactions to making real-time trading decisions. AI algorithms analyze financial data to identify patterns, predict market trends, and provide personalized financial advice, transforming how individuals and institutions manage their assets.

  • Agriculture: AI is being used to optimize agricultural practices through precision farming. AI-powered sensors and drones collect data on soil health, weather conditions, and crop growth, allowing farmers to make data-driven decisions that increase yields while minimizing resource use.

  • Environmental Monitoring: AI also contributes to environmental sustainability by monitoring natural resources, predicting climate changes, and optimizing energy usage. AI models are used to predict natural disasters, monitor deforestation, and support conservation efforts, helping us protect the planet more effectively.

These examples illustrate just a fraction of the ways in which AI is being implemented today. The breadth of AI's applications demonstrates its potential to drive positive change across industries and improve the quality of life for people around the world. However, realizing this potential requires intentional action. We must all take responsibility and be motivated to address ethical and inequality issues in AI adoption. By doing so, we can ensure that AI is not just another technological wave but a transformative force that benefits everyone.

Moving Forward: A Positive Vision for AI Adoption

Despite the challenges, the future of AI adoption holds incredible promise. By paying close attention to ethical considerations and actively working to address inequalities, we can create an environment where AI becomes a tool for empowerment and progress for all. I am optimistic about AI's potential to revolutionize industries and improve the quality of life for people around the world. Ensuring inclusive AI adoption means making deliberate efforts to extend access, educate broadly, and involve diverse communities in the development and implementation of AI technologies.

Remember that AI is a tool—one that holds the potential to improve lives, solve complex problems, and enhance human capabilities. The responsibility lies with all of us—policymakers, technologists, educators, and community members—to shape the trajectory of AI adoption in ways that reflect our shared values and aspirations.

Posts in the series

Addressing Inequality in AI Adoption: Toward a More Inclusive Future

One critical challenge we must urgently address is the potential for AI to exacerbate existing inequalities or create new divides. As we saw with previous technological innovations like personal computing and the internet, early adopters often benefit significantly, while those with limited access are left behind. To create an inclusive future, we must proactively ensure that AI is accessible, understandable, and beneficial to all segments of society rather than just a privileged few.

The Digital Divide and AI

The concept of the digital divide emerged prominently during the advent of personal computers and the internet. Those with access to digital tools and the ability to use them gained significant advantages in education, employment, and economic opportunities. In contrast, those without access were disadvantaged significantly (Norris, 2001). AI risks creating a similar divide, where those with access to AI tools, skills, and infrastructure can advance more quickly while others are left behind.

Historical Parallels: Lessons from the Past

  • Personal Computing and Internet Adoption: During the 1980s and 1990s, personal computers and the Internet became crucial tools for education, business, and communication. However, their adoption was uneven, with certain groups benefiting significantly while others struggled due to lack of access, affordability, or digital literacy (Selwyn, 2004). Similarly, AI adoption today risks being skewed in favor of those with technological advantages unless deliberate efforts are made to democratize access.

  • The AI Divide: Just as with earlier digital technologies, AI adoption could lead to a divide between those who can leverage AI effectively and those who cannot. This disparity could impact job opportunities, education, and access to information, reinforcing social and economic inequities.

Making AI Adoption More Inclusive

To address the risks of inequality and ensure that AI adoption is more inclusive, we must focus on several key areas: access, education, and the ethical development of AI technologies.

Access and Infrastructure

  • Investment in Infrastructure: It is essential to ensure all communities have access to the infrastructure needed to leverage AI. This includes access to high-speed internet, affordable devices, and AI tools. Governments and private sector partnerships must invest in infrastructure to bridge the gap between urban and rural areas and ensure equitable access to AI technologies.

  • Affordability: AI tools and resources must be affordable for many users. This requires collaboration between policymakers, technology companies, and community organizations to create subsidies or pricing models that make AI accessible to underserved populations.

Education and Digital Literacy

  • AI Literacy Programs: Just as digital literacy programs helped bridge the divide during the Internet revolution, AI literacy programs can play a crucial role in democratizing access to AI. These programs should focus on assisting individuals to understand what AI is, how it works, and how it can be applied to improve their lives. By making AI concepts accessible, we can empower people to engage with and benefit from AI technologies.

  • Targeted Education Initiatives: Education initiatives should target traditionally underserved or underrepresented groups in the tech sector. This includes women, low-income communities, and marginalized racial and ethnic groups. Providing targeted support to these communities can help foster a more inclusive AI landscape.

  • The Role of Educators: Educators can ensure that AI adoption is inclusive. As AI tools become more prevalent, educational approaches will need to evolve to incorporate these tools effectively. Teachers and instructors must adapt their methods to account for students' access to AI platforms, shifting from traditional teaching models to approaches that leverage AI as a learning companion. This means focusing on how students can critically assess and interact with AI outputs, fostering skills that help them use AI responsibly and creatively. Educators can ensure students are well-prepared to navigate an AI-driven world by incorporating AI literacy into curricula.

Ethical and Responsible AI Development

  • Avoiding Bias and Discrimination: Ensuring AI systems are developed without bias is critical to promoting equality. AI models are only as good as the data they are trained on, and biased data can lead to discriminatory outcomes (O'Neil, 2016). Developers must prioritize fairness by using diverse datasets and implementing checks to detect and mitigate bias.

  • Community Involvement in AI Design: Including diverse voices in developing AI technologies is essential for creating systems that serve everyone. This means engaging with communities to understand their needs and incorporating their feedback into the design process.

Moving Forward: Creating a Fair AI Future

To avoid repeating past mistakes, we must take deliberate steps to ensure that AI adoption is equitable. This means addressing infrastructure and access, providing education and training, and developing AI systems ethically and responsibly. By doing so, we can create a future where AI, if harnessed correctly, can be a powerful tool for empowerment and equality that is accessible to all.

Call to Action

Policymakers, educators, technology companies, and community leaders all have a role to play in making AI adoption more inclusive. Through collaborative efforts such as investments in infrastructure, education initiatives, or ethical AI development, we can ensure that AI helps bridge gaps rather than widen them.

Posts in the series

References

Norris, P. (2001). Digital divide: Civic engagement, information poverty, and the Internet worldwide. Cambridge University Press.

O'Neil, C. (2016). Weapons of math destruction: How big data increases inequality and threatens democracy. Crown Publishing Group.

Selwyn, N. (2004). Reconsidering political and popular understandings of the digital divide. New Media & Society, 6(3), 341-362. https://doi.org/10.1177/1461444804042519

Reference Summary

  1. Norris, P. (2001). Digital Divide: Civic Engagement, Information Poverty, and the Internet Worldwide. This book analyzes how adopting digital technologies, like computers and the Internet, created inequalities between those with access to technology and those without. It offers an important historical context for understanding potential inequalities in AI adoption.

  2. O'Neil, C. (2016). Weapons of Math Destruction: How Big Data Increases Inequality and Threatens Democracy. Cathy O'Neil's book addresses the dangers of algorithmic bias and how data-driven technologies can perpetuate social inequalities. It highlights the importance of ethical considerations in AI design and deployment.

  3. Selwyn, N. (2004). Reconsidering Political and Popular Understandings of the Digital Divide. This paper revisits the digital divide concept, emphasizing the role of education and policy in bridging gaps in digital literacy. It provides insights into how similar efforts can be applied to AI adoption.

Ethical Considerations of AI Adoption

As artificial intelligence (AI) technologies, products, and services continue to expand we also have to address the ethical considerations accompanying AI integration into our daily lives. Beyond the practicalities of technology use, there are questions about ethics, human autonomy, privacy, and fairness. AI challenges our ethical frameworks and raises important concerns about how we responsibly deploy and regulate this technology.

Anthropomorphism and AI

The human tendency to anthropomorphize—to attribute human-like traits to non-human entities—plays a significant role in shaping our interactions with AI. When people see AI systems as more human, it can enhance engagement and acceptance. However, this anthropomorphism also raises ethical questions related to expectations and trust (Duffy, 2003).

Emotional Engagement and Ethical Design

  • Emotional Engagement: When users anthropomorphize AI, they may form emotional bonds with these systems, as seen with social robots and virtual assistants. While this engagement can increase user satisfaction, it also creates ethical concerns regarding transparency and manipulation (Turkle, 2011).

  • Ethical Design: Designers must consider how human-like attributes in AI systems impact users. Empathetic or trustworthy appearing AI products may encourage users to overestimate the system's capabilities or place undue trust in its outputs (Duffy, 2003).

The Nature of Intelligence and Consciousness

The development of AI prompts us to question our definitions of intelligence and consciousness. These concepts have traditionally been linked to human cognition, but AI forces us to reconsider what it means to be intelligent.

Defining Intelligence

  • Human vs. Machine Intelligence: AI's ability to process information and perform tasks that require reasoning challenges the distinction between human and machine intelligence (Searle, 1980). While AI can solve complex problems, it lacks the experiential, emotional, and subjective aspects of human intelligence, which raises questions about the depth and nature of its "understanding."

Consciousness and AI

  • The Chinese Room Argument: Philosopher John Searle's Chinese Room argument posits that while AI can simulate understanding, it does not possess genuine consciousness or understanding (Searle, 1980). This distinction is crucial in framing ethical debates around AI's role and limitations as a non-sentient tool.

Ethical Implications of AI Integration

The integration of AI into society presents significant ethical considerations. It is not just about enhancing productivity and efficiency but also about addressing concerns related to autonomy, privacy, and fairness.

Autonomy and Control

  • Balancing Human and AI Decision-Making: As AI systems become more capable, they may increasingly assist or replace human decision-making. However, this raises ethical questions about how much control humans should cede to machines. Ensuring that humans control critical decisions is essential to maintaining autonomy (Bryson, 2018).

Privacy and Surveillance

  • Data Collection and Consent: AI systems often rely on large datasets to function effectively, raising concerns about privacy and consent. Users must be informed about how their data is being used and have the ability to control their information (Zuboff, 2019).

Fairness and Bias

  • Mitigating Algorithmic Bias: AI systems can inherit biases in the data they are trained on, leading to discriminatory outcomes. Addressing algorithmic bias is critical to ensuring that AI technologies do not perpetuate or exacerbate social inequalities (O'Neil, 2016).

Conclusion

The ethical considerations of AI adoption challenge us to think critically about the role of technology in our lives. By reflecting on anthropomorphism, the nature of intelligence, and the ethical implications of AI integration, we can navigate the complexities of AI adoption more thoughtfully. As we continue to develop and deploy AI technologies, we must ensure that our ethical frameworks evolve in tandem, guiding us toward responsible and equitable AI use.

In the next post, I will explore AI's societal impact and the inequalities that may arise from its adoption, focusing on how to foster more inclusive and equitable technology integration.

Posts in the series

References

Bryson, J. J. (2018). The past decade and future of AI's impact on society. Towards a New Enlightenment? A Transcendent Decade, 206-213.

Duffy, B. R. (2003). Anthropomorphism and the social robot. Robotics and Autonomous Systems, 42(3-4), 177-190. https://doi.org/10.1016/S0921-8890(02)00374-3

O'Neil, C. (2016). Weapons of math destruction: How big data increases inequality and threatens democracy. Crown Publishing Group.

Searle, J. R. (1980). Minds, brains, and programs. Behavioral and Brain Sciences, 3(3), 417-424. https://doi.org/10.1017/S0140525X00005756

Turkle, S. (2011). Alone together: Why we expect more from technology and less from each other. Basic Books.

Zuboff, S. (2019). The age of surveillance capitalism: The fight for a human future at the new frontier of power. PublicAffairs.

Reference Summary

  1. Bryson, J. J. (2018). The Past Decade and Future of AI's Impact on Society. Joanna Bryson's work discusses AI's societal impacts, emphasizing the importance of maintaining human control over AI systems to preserve autonomy. It provides insights into ethical decision-making and control in AI integration.

  2. Duffy, B. R. (2003). Anthropomorphism and the Social Robot. This paper explores the implications of anthropomorphizing robots, discussing how attributing human traits to AI can influence user trust and interaction. It raises ethical concerns about transparency and the potential for manipulation.

  3. O'Neil, C. (2016). Weapons of Math Destruction: How Big Data Increases Inequality and Threatens Democracy. Cathy O'Neil's book addresses the dangers of algorithmic bias and how data-driven technologies can perpetuate social inequalities. It highlights the importance of ethical considerations in AI design and deployment.

  4. Searle, J. R. (1980). Minds, Brains, and Programs. John Searle's paper introduces the Chinese Room argument, which challenges the notion that AI can possess true understanding or consciousness. It provides a philosophical basis for distinguishing between genuine intelligence and mere simulation.

  5. Turkle, S. (2011). Alone Together: Why We Expect More from Technology and Less from Each Other. Sherry Turkle's book explores the emotional impact of technology on human relationships, particularly focusing on how anthropomorphized technologies can affect social dynamics and user expectations.

  6. Zuboff, S. (2019). The Age of Surveillance Capitalism: The Fight for a Human Future at the New Frontier of Power. Shoshana Zuboff's book examines how data collection and surveillance have become integral to modern capitalism, raising ethical concerns about privacy and user consent in the age of AI.

Technology Adoption Models & AI

To fully understand the adoption of artificial intelligence (AI), it's important to explore the theories that explain how new technologies spread through societies. Why do some readily embrace technological advancements while others are hesitant or resistant? Technology adoption models provide frameworks to understand these behaviors, revealing the factors that drive or hinder the adoption of innovations like AI.

Two key models that stand out in understanding technology adoption are Everett Rogers' Diffusion of Innovations theory and the Technology Acceptance Model (TAM). These models shed light on the societal spread of technology and the individual decision-making processes that determine whether a person will adopt a new tool or system. By exploring these models, we can better understand the dynamics of AI adoption and identify strategies to facilitate it, ensuring a more inclusive and effective integration of AI into various aspects of our lives.

Diffusion of Innovations: Understanding the Adoption Lifecycle

Everett Rogers' Diffusion of Innovations theory categorizes adopters into five groups: Innovators, Early Adopters, Early Majority, Late Majority, and Laggards. Each group's unique characteristics and approach to new technologies highlight the diverse nature of technology adoption. Key takeaways include:

  • Innovators and Early Adopters: These pioneers in the adoption process are propelled by a readiness to take risks and a thirst to be at the vanguard of new technologies. Their role is pivotal in generating momentum and establishing credibility for innovations.

  • The Early Majority: This group waits for proof of effectiveness before adopting, emphasizing the importance of demonstrating tangible benefits and reducing uncertainties surrounding new technologies.

  • The Late Majority and Laggards: These groups are more resistant, often requiring external pressures or undeniable evidence of utility before embracing change. To reach these groups, widespread acceptance and normalization of technology are needed.

Factors Influencing Adoption

Rogers pinpoints five factors that influence the adoption rate of innovations: relative advantage, compatibility, complexity, trialability, and observability. Understanding these factors is key to devising effective strategies for technology adoption (Rogers, 2003).

  • Relative Advantage: This refers to the degree to which an innovation is perceived as better than the existing solution. The greater the perceived advantage, the faster the adoption rate. For AI products, emphasizing clear benefits—such as increased efficiency, cost savings, or improved accuracy—will encourage adoption.

  • Compatibility: Compatibility is the extent to which an innovation is consistent with the existing values, past experiences, and needs of potential adopters. AI solutions that align with current workflows or integrate seamlessly with familiar tools are more likely to be adopted. Developers must design AI technologies that fit into users' existing practices to minimize resistance.

  • Complexity: Refers to how difficult an innovation is to understand and use. The more complex a technology seems, the slower the adoption. To promote AI adoption, products should be user-friendly, with intuitive interfaces and accessible documentation. Simplifying AI tools and reducing their perceived difficulty can help overcome adoption barriers.

  • Trialability: This factor represents the ability to experiment with an innovation on a limited basis before committing fully. Providing free trials, demos, or pilot programs can significantly enhance AI adoption, allowing users to experience firsthand benefits without risk. Trialability reduces uncertainty, making users more comfortable integrating AI into their workflows.

  • Observability: Observability is the degree to which the results of an innovation are visible to others. When peers or competitors easily observe the benefits of using AI, it creates social pressure to adopt. Highlighting successful use cases and sharing real-world outcomes can demonstrate the value of AI, motivating others to follow suit.

Technology Acceptance Model: The Role of Perceived Usefulness and Ease of Use

The Technology Adoption Model (TAM) proposes that two primary factors influence an individual's decision to use a new system: its usefulness and ease of use.

  • Perceived Usefulness: This is the degree to which a person believes using a particular technology will enhance their job performance or life, highlighting the importance of demonstrating the practical benefits and improvements an innovation can bring to potential users (Davis, 1989).

  • Perceived Ease of Use: This refers to how easy the potential adopter believes it is to use the technology. Simplifying the user experience and minimizing the learning curve can significantly impact adoption rates (Davis, 1989).

Expanding TAM: Additional Factors and Their Implications

The original TAM has been expanded upon in various iterations to include additional factors such as social influence, facilitating conditions, and perceived risk, reflecting the complex interplay of personal, social, and technological factors in technology adoption (Venkatesh & Bala, 2008).

  • Social Influence: This refers to how individuals perceive that important others (e.g., peers, supervisors, or influential figures) believe they should use a particular technology. Social influence can significantly impact AI adoption, especially in organizational settings. If influential figures within a company advocate for using AI, it can encourage more employees to adopt it. Demonstrating endorsements from industry leaders or peer testimonials for AI products can help drive adoption.

  • Facilitating Conditions: These are the resources and support available to users that make adopting a new technology easier. Facilitating conditions include access to training, technical support, and infrastructure. For AI products, ensuring users have access to comprehensive onboarding, tutorials, and ongoing support can reduce barriers to adoption and enhance the user experience. AI adoption is more likely when individuals feel confident they have the necessary resources and support to use the technology effectively.

  • Perceived Risk: Perceived risk involves the potential negative consequences of using new technology, such as concerns about data privacy or job displacement. Addressing perceived risk is crucial for AI adoption, especially given concerns about privacy and ethical implications. Developers must build trust by ensuring transparency in data usage, implementing robust security measures, and clearly communicating how AI technologies will impact users' roles and responsibilities.

Implications for AI Adoption

These theories provide valuable insights into the ongoing integration of AI into various aspects of life and work. By understanding the factors that influence technology adoption, developers, marketers, and policymakers play a crucial role in devising strategies that address barriers to adoption, highlight the advantages of AI, and ultimately foster a more inclusive and effective integration of these technologies into society.

AI adoption is not solely about overcoming technical challenges but also about navigating the human elements of fear, uncertainty, and resistance to change. By applying the lessons from the Diffusion of Innovations and the Technology Acceptance Model, we can better understand and appreciate the significance of these human factors, thereby facilitating the path toward widespread acceptance and utilization of AI technologies.

Posts in the series

References

Davis, F. D. (1989). Perceived usefulness, perceived ease of use, and user acceptance of information technology. MIS Quarterly, 13(3), 319-340. https://doi.org/10.2307/249008

Rogers, E. M. (2003). Diffusion of innovations (5th ed.). Free Press.

Venkatesh, V., & Bala, H. (2008). Technology acceptance model 3 and a research agenda on interventions. Decision Sciences, 39(2), 273-315. https://doi.org/10.1111/j.1540-5915.2008.00192.x

Reference Summary

  1. Davis, F. D. (1989). Perceived Usefulness, Perceived Ease of Use, and User Acceptance of Information Technology. This foundational paper introduces the Technology Acceptance Model (TAM), highlighting the importance of perceived usefulness and perceived ease of use in determining user acceptance of new technologies. It provides a crucial framework for understanding how individual perceptions influence technology adoption.

  2. Rogers, E. M. (2003). Diffusion of Innovations. Everett Rogers' book is a key text in understanding how innovations spread through societies. It categorizes adopters into different groups and identifies factors that influence the rate of adoption, providing valuable insights for promoting new technologies like AI.

  3. Venkatesh, V., & Bala, H. (2008). Technology Acceptance Model 3 and a Research Agenda on Interventions. This paper expands on the original TAM, incorporating additional factors like social influence and facilitating conditions. It offers an evolved perspective on how to promote technology adoption through targeted interventions.

The Role of Need for Cognition in Technology Adoption

In the complex world of human-technology interaction, psychological traits play a crucial role in how individuals approach, perceive, and integrate emerging technologies. One such psychological trait, the need for cognition (NFC), significantly influences how people engage with innovations like artificial intelligence (AI). Understanding the role of NFC can provide insights into fostering inclusive technology adoption, ensuring that diverse cognitive preferences are accounted for in the design and communication of new technologies.

Understanding Need for Cognition

The need for cognition is a psychological trait that reflects an individual's propensity to engage in and enjoy effortful cognitive activities. People with high NFC derive pleasure from solving complex problems, grappling with abstract concepts, and engaging in deep, reflective thinking (Cacioppo & Petty, 1982). Conversely, individuals with low NFC prefer simpler, more straightforward tasks requiring less cognitive effort.

High NFC Individuals

  • Openness to New Experiences: High NFC individuals are typically more open to new technologies, including AI, because they are naturally curious and motivated to understand how things work (Cacioppo et al., 1996). Their desire to explore complex systems makes them more likely to engage deeply with emerging technologies.

  • Exploration and Experimentation: They are more inclined to explore the full capabilities of new technologies, uncovering features that others may overlook. This thorough exploration often leads to a more comprehensive understanding and integration of new technology systems into their lives.

  • Innovative Use of Technology: High NFC individuals often find novel ways to use technology, pushing the boundaries of what is possible and identifying potential applications that may not have been immediately apparent.

Low NFC Individuals

  • Preference for Ease of Use: Low NFC individuals may approach new technology with hesitation, often requiring that the technology be straightforward and easy to use before they are willing to adopt it (Cacioppo et al., 1996). Minimizing the cognitive load associated with learning new systems is crucial for these individuals.

  • Need for Guidance: They are more likely to benefit from step-by-step guidance, tutorials, or user support, which can help lower the perceived complexity of new technologies and make them more accessible.

  • Impact on Adoption Rates: Due to their preference for simplicity, low NFC individuals may only adopt new technologies once the benefits are clear and the learning curve has been minimized, which can influence overall societal adoption rates.

Implications for Technology Adoption

The concept of NFC has important implications for how we approach technology adoption, particularly AI. Recognizing the differences in cognitive styles can help technologists, marketers, and educators design more inclusive adoption strategies.

Designing for Cognitive Diversity

  • Tailored User Interfaces: Products can offer options catering to different NFC levels. For instance, advanced features can be optional, allowing high NFC individuals to explore while providing a simplified interface for low NFC users and products that help with specific, clear user outcomes.

  • Educational Resources: Providing various educational resources, such as detailed manuals for high NFC users and quick-start guides or video tutorials for low NFC users, can help bridge the gap in technology adoption.

Marketing and Communication Strategies

  • Highlighting Complexity for High NFC: Marketing materials that emphasize AI's sophistication, potential, and challenges are likely to attract high NFC individuals who enjoy deep cognitive engagement.

  • Simplifying Messaging for Low NFC: Focusing on ease of use, practical benefits, and straightforward functionality is essential for low NFC individuals. Demonstrating how the technology can solve everyday problems without significant effort can improve adoption rates.

Case Study: NFC and Internet Adoption

The role of NFC in technology adoption can be illustrated through the early adoption of the Internet. In the 1990s, individuals with high NFC were among the first to explore the internet's potential. They engaged with the complexity of setting up connections, navigating text-based interfaces, and exploring the early capabilities of online communication. Their willingness to embrace and understand this complexity contributed to internet applications' initial growth and innovation (Rogers, 2003).

In contrast, individuals with low NFC were more hesitant to adopt the internet until user-friendly browsers, simplified interfaces, and clear benefits emerged. The development of graphical web browsers like Netscape Navigator significantly lowered the barriers to entry, making the internet accessible to a broader audience by reducing the cognitive effort required to navigate the online world (Rogers, 2003).

Conclusion

The need for cognition influences how individuals approach AI adoption. By understanding and addressing users' varying cognitive needs, we can create more inclusive and accessible technologies. Whether by offering customizable user experiences, providing diverse educational resources, or tailoring marketing strategies, considering NFC in technology design and adoption efforts is crucial for ensuring that innovations like AI benefit as many people as possible.

In the next post, I will continue to explore the dynamics of AI adoption by examining how technological and societal factors influence the integration of emerging technologies.

Posts in the series

References

Cacioppo, J. T., & Petty, R. E. (1982). The need for cognition. Journal of Personality and Social Psychology, 42(1), 116-131. https://doi.org/10.1037/0022-3514.42.1.116

Cacioppo, J. T., Petty, R. E., Feinstein, J. A., & Jarvis, W. B. G. (1996). Dispositional differences in cognitive motivation: The life and times of individuals varying in need for cognition. Psychological Bulletin, 119(2), 197-253. https://doi.org/10.1037/0033-2909.119.2.197

Rogers, E. M. (2003). Diffusion of innovations (5th ed.). Free Press.

Reference Summary

  1. Cacioppo, J. T., & Petty, R. E. (1982). The Need for Cognition. This foundational paper introduces the concept of need for cognition (NFC), a psychological trait that reflects an individual's tendency to engage in and enjoy cognitive activities. It provides a framework for understanding how differences in cognitive motivation can influence technology adoption.

  2. Cacioppo, J. T., Petty, R. E., Feinstein, J. A., & Jarvis, W. B. G. (1996). Dispositional Differences in Cognitive Motivation. This paper expands on the concept of NFC, discussing how individuals with high NFC are likelier to engage deeply with complex ideas and technologies. It highlights the implications of NFC for understanding user engagement with emerging technologies like AI.

  3. Rogers, E. M. (2003). Diffusion of Innovations (5th ed.). Rogers' book provides a comprehensive framework for understanding how new technologies spread through society. It includes insights into how early adopters with high NFC drive initial adoption, while broader accessibility is needed to engage those with lower NFC.

The Psychological Perspective on AI Adoption

Understanding the psychological factors that influence how individuals engage with and integrate new technologies into their lives can help us understand what artificial intelligence (AI) adoption will look like over the coming years. Our cognitive styles and emotional reactions play significant roles in shaping our interactions with new technologies, including AI, highlighting the complexities of technology adoption on a personal level. Recognizing these nuances can empower us to navigate AI adoption more effectively, knowing that our unique cognitive styles and emotional reactions are tools for engagement rather than barriers.

Cognitive Styles and AI Adoption

Cognitive style refers to how individuals think, perceive, and remember information. Two aspects significantly influence AI adoption: exploratory learning and adaptability and flexibility.

Exploratory Learning

Individuals with an exploratory learning style tend to embrace new tools and technologies more readily. This cognitive style, characterized by natural curiosity and a desire to understand the mechanics behind things, facilitates a deeper connection with new technologies such as AI. These individuals are comfortable with ambiguity and complexity, often seeing new technologies as opportunities for learning and growth (Kolb, 1984).

  • Comfort with ambiguity: Exploratory learners thrive in uncertain environments, which makes them more resilient to rapidly evolving AI technologies.

  • Propensity for problem-solving: Their intrinsic motivation to solve problems enables them to navigate complex AI systems effectively.

  • Higher technological literacy: Regular engagement with new technologies enhances their overall tech literacy, making future tech adoptions smoother.

Case Study: The Homebrew Computer Club

The Homebrew Computer Club, formed in the mid-1970s in Silicon Valley, exemplifies the impact of an exploratory learning style on technology adoption. This group of computer enthusiasts met regularly to share ideas and projects, driven by curiosity and a desire to solve problems. Their experience provides a real-world example of how an exploratory learning style can lead to successful technology adoption, a lesson directly applicable to the current AI landscape.

  • Comfort with Ambiguity: Club members thrived in the uncertain landscape of early personal computing, figuring things out independently without formal documentation or established practices.

  • Propensity for Problem-Solving: They shared successes and failures openly, continuously iterating on their designs and learning from each other's experiences.

  • Higher Technological Literacy: Regular engagement with the latest hardware and software developments enhanced their technological literacy, paving the way for future innovations.

Key figures like Steve Wozniak and Lee Felsenstein were part of this collaborative environment, leading to the creation of early successful personal computers like the Apple I. The Homebrew Computer Club's legacy demonstrates the power of curiosity, collaboration, and a willingness to explore the unknown, providing valuable lessons for today's AI adoption.

Adaptability and Flexibility

Adaptable and flexible individuals are more likely to integrate AI into their personal and professional lives successfully. Adaptability allows for a more fluid interaction with AI technologies, accommodating and leveraging their evolving capabilities (Ployhart & Bliese, 2006).

  • Willingness to experiment: Adaptable individuals are likelier to try out new AI tools and applications, even if initially unfamiliar. These include virtual assistants, predictive analytics software, or AI-powered customer service platforms. Their adaptability allows them to quickly learn and adapt to these tools, leveraging their potential benefits.

  • Perseverance through challenges: They view setbacks as learning opportunities rather than failures, fostering resilience.

  • Openness to changing strategies: Flexibility in adjusting approaches ensures they can effectively incorporate AI into various contexts.

Emotional Reactions to Technology

Our emotional responses to technology, ranging from enthusiasm and optimism to anxiety and fear, also impact AI adoption.

Technological Optimism

For many, the excitement surrounding AI's potential heralds a future of limitless possibilities. This optimism can enhance engagement with AI, prompting individuals to explore and leverage its capabilities more fully (Rogers, 2003).

  • Views challenges as solvable: Optimistic individuals are more likely to perceive technical issues as temporary obstacles that can be overcome.

  • Positive engagement with AI: Their enthusiasm drives them to seek out new AI tools and applications actively.

  • Exploration of AI's potential: They are more inclined to experiment with AI, uncovering innovative uses and benefits.

Anxiety and Technophobia

Emotional responses to technology, such as anxiety or fear, can hinder technology adoption. Individuals experiencing technophobia might avoid engaging with AI, missing out on its benefits due to fear of complexity or adverse outcomes (Rosen & Weil, 1997).

  • Limitation on experimentation: Anxiety can prevent individuals from trying new technologies, limiting their exposure and understanding.

  • Avoidance of AI benefits: Fear can lead to missed opportunities for improvement and efficiency that AI offers.

  • The impact of supportive education: Resources and training can help alleviate technophobia, enabling more individuals to adopt AI confidently. For instance, workshops on AI basics, online tutorials for specific AI tools, or mentorship programs for AI novices can all contribute to building confidence and reducing fear, thereby promoting AI adoption.

Conclusion

Understanding these psychological dynamics is essential for fostering more inclusive and practical approaches to AI adoption. By recognizing the diversity in cognitive styles and emotional reactions, and with the proper supportive education, educators, technologists, and policymakers can develop strategies that accommodate a broader range of users, ensuring that the benefits of AI are accessible to all.

The following post will explore Need for Cognition (NFC), another important psychological trait that may indicate new technology adoption approaches.

Posts in the series

References

Kolb, D. A. (1984). Experiential learning: Experience as the source of learning and development. Prentice-Hall.

Ployhart, R. E., & Bliese, P. D. (2006). Individual adaptability (I-ADAPT) theory: Conceptualizing the antecedents, consequences, and measurement of individual differences in adaptability. Advances in Human Performance and Cognitive Engineering Research, 6, 3-39.

Rogers, E. M. (2003). Diffusion of innovations (5th ed.). Free Press.

Rosen, L. D., & Weil, M. M. (1997). TechnoStress: Coping with Technology at Work, at Home, and at Play. Wiley.

Reference Summary

  1. Kolb, D. A. (1984). Experiential Learning: Experience as the Source of Learning and Development. This book introduces the concept of experiential learning, emphasizing the importance of hands-on, exploratory learning in adopting new technologies. It is particularly relevant for understanding how cognitive styles influence AI adoption.

  2. Ployhart, R. E., & Bliese, P. D. (2006). Individual Adaptability (I-ADAPT) Theory. This paper discusses individual differences in adaptability, providing insights into how flexibility and adaptability can impact technology adoption. It is useful for understanding why some people are more willing to integrate AI into their routines.

  3. Rogers, E. M. (2003). Diffusion of Innovations. Everett Rogers' book is a key text in understanding how innovations spread through societies. It categorizes adopters into different groups and identifies factors that influence the rate of adoption, providing valuable insights for promoting new technologies like AI.

  4. Rosen, L. D., & Weil, M. M. (1997). TechnoStress: Coping with Technology at Work, at Home, and at Play. This book explores the psychological stress and anxiety related to technology use, known as technophobia. It provides a comprehensive look at how individuals react to the rapid adoption of technology and offers strategies to cope with these challenges, making it a valuable reference for understanding psychological barriers to AI adoption.

Chapter 1.4: Gathering the Inputs - Taking Action

BRINGING IT ALL TOGETHER

This is perhaps the most difficult step in the playbook, and many business articles are written on the myths of implementation of strategy and execution failures (1, 2). Exhibit 4 visualizes the operational cadences based on concepts from Hoshin Kanri (3), modified for software companies implementing agile development practices: 1) 3-5 year strategy, 2) yearly operating plan, 3) quarterly goals and roadmaps, 4) monthly report-outs, and 5) bi-weekly demos and retrospectives to practice continual improvement.

Operational cadences at 3-5 year, 1-year, quarterly, monthly, and bi-weekly time horizons.

Operational cadences at 3-5 year, 1-year, quarterly, monthly, and bi-weekly time horizons.

I especially appreciate the work of Sull, Homkes, & Sull (2015) on this topic as it highlights an opportunity to combine the approaches practiced in design (collaborative ideation and execution), leadership (individual behaviors), and organizational design (team behaviors) at the top levels of business management and across the entire firm.

Design Thinking

Beyond the buzzwords and hype, the point of design thinking is that the approach is methodological, scientific, and collaborative. Design thinking proposes understanding our assumptions, conducting research to uncover new or refute current hypotheses, deriving insights, ideating concepts, and creating prototypes and strategies for evaluating ideas (4). In the field of design, we bring teams together to uncover these assumptions and insights, conduct research, design concepts, and test them through prototypes. We work with product and engineering or service development partners to create a vision, and continuously refine our ideas, throwing out what does not work and adding only where necessary. In 101 Design Methods: A Structured Approach for Driving Innovation in Your Organization, Kumar provides a breadth of methodological approaches to innovation, market sensing, and ideation, all of which are conducted as workshops with cross-functional peers (5).

I approach strategic, operational, and execution planning from the designer’s perspective: as a facilitator of the generation of the best ideas, rather than the sole proprietor of strategy and direction. With the information from phases 2 and 3, a team can come together to generate ideas, formulate hypotheses, and establish a clear vision and strategy for the firm.

Leadership Practices

In my experience, the design thinking approach models to others how I expect them to behave, establishes a shared vision with the team, enables them to act with the same information shared across the individuals, provides opportunities to challenge the process, and gives rise to opportunities to encourage and celebrate learning. These also happen to be the top five leadership behaviors identified by Kouzes & Posner in their research for the book Leadership Challenge: How to Make Extraordinary Things Happen in Organizations (2012) (6). Effective leaders don’t try to do everything on their own, and according to Kouzes & Posner, employee engagement is correlated strongly to these five leadership behaviors. But for a leader to be effective, they need a strong team that is focused on results.

Organizational Design

Design thinking approaches and effective leadership are only as good as the teams we are leading. The final piece of enabling people to execute a strategy is ensuring they are effective teams. In Five Dysfunctions of a Team (2006) (7), Lencioni identifies five elements of teamwork that lead to a results-oriented organization. First, the team must have established enough trust to admit to errors and weaknesses. This important step establishes the vulnerability needed to enable critical debate. Like any good movie, conflict is the driver of progress. Trusting each other enables us to have healthy conflict around process and approach and avoid the distraction and political maneuvering of interpersonal conflict. For strategy and execution, conflict arises when we differ on our understanding of the data and are vulnerable enough to bring our perspective to the table without fear of reprisal.

Healthy conflict leads to commitment. A team that feels they have been heard and participated in decision-making is more likely to commit to a goal than a team that is told what to do without a voice. A committed team can then hold each other accountable, both to team norms and team goals. A team that feels they have been heard raises fewer show-stopping questions along the way, is more confident in their understanding, and can make decisions in the face of uncertainty because they have the information needed to make a call and know that if they make a mistake, the team will celebrate learning, adjust course, and move on.

Finally, a team that trusts each other, has healthy conflict, is committed, and holds each other accountable, can focus on results. These are what we think of as high-performing teams. A mistake I have made along the way is focusing on results without first taking a team through the stages of team development. Another mistake is forgetting that every time the team changes, someone new joins, or someone leaves, we need to reset, rebuild trust, and enable conflict and commitment.

CONCLUSION

There is no silver bullet for effective teams, organizations, firms, or strategies. This playbook combines my experience with psychological science, leadership, design, and strategy to provide a methodological, scientific approach to strategic analysis and organizational leadership. The nuances of individuals, teams, cultures, and environments create uncertainty, and the key principle of design is to draw upon uncertainty to inspire insights, concepts, and strategies through a scientific approach to establish a shared vision and enable others to act.

SECTIONS IN THIS CHAPTER

REFERENCES

  1.  Sull, D., Homkes, R., & Sull, C. (2015). Why strategy execution unravels—and what to do about it. Harvard Business Review, 93(3), 57-66.

  2.  Kaplan, S., & Beinhocker, E. D. (2003). The real value of strategic planning. MIT Sloan Management Review, 44(2), 71.

  3.  Zairi, M., & Erskine, A. (2011). Excellence is Born out of Effective Strategic Deployment: The Impact of Hoshin Planning,". International Journal of Applied Strategic Management, 2(2), 1-28.

  4.  Blevis, E., & Siegel, M. (2005). The explanation for design explanations. In 11th international conference on human-computer interaction: Interaction design education and research: Current and future trends.

  5.  Kumar, V. (2012). 101 design methods: A structured approach for driving innovation in your organization. John Wiley & Sons.

  6.  Kouzes, J. M., & Posner, B. Z. (2012). The leadership challenge: How to make extraordinary things happen in organizations. Panarchy, the collapse of the Canadian health care system, 124.

  7.  Lencioni, P. (2006). The five dysfunctions of a team. John Wiley & Sons.

Chapter 1.3: Gathering the Inputs - Deep Strategic Analysis

Phase 3: Strategic Analysis

Phase 3 is the most data-rich phase and sets up the organization's leaders to have prepared minds for bringing everything together. In this phase, I lead teams to conduct a thorough external, competitive, and firm analysis. The details of the analysis can be found in Walker & Madsen’s Modern Competitive Strategy (1), but I will provide a summary here. It is important to note that this analysis will take time upfront, and rely on regular research to stay up-to-date. In some cases, it may be difficult to identify a single industry, so the analysis must be conducted on multiple industries. This can be the case for innovative organizations creating new markets, for example, Netflix originally competed with Blockbuster for the rental market then cable and network TV for the on-demand market, and finally created the on-demand streaming market. 

The strategic analysis phase consists of external and competitive analysis and internal firm analysis. Exhibit 5 is a strategic analysis canvas designed to help guide the collaborative approach to this structured analysis.

Exhibit 5: Strategic Analysis Canvas

Exhibit 5: Strategic Analysis Canvas

External analysis

The first step of the external analysis is to identify the industries the firm is operating in and examine in detail the industry conditions. Porter’s forces analysis framework is a helpful tool for this, reviewing the barriers to entry, the threat of rivalry, the threat of substitutes, the power of complementors, and the power of suppliers and buyers to deeply understand industry dynamics (2). In addition to the forces, we also review technological, social, ethical, and economic trends in the industry to form a complete picture of the landscape.

Competitive analysis

In phase 2, we identified the main competitors for our product or service. In the competitive analysis, we go deeper to identify and examine the resources and capabilities of competing firms. I use tools such as VRIO, Value-Cost (V-C) (3) and value chain analyses (4) to understand how the competitors are playing the game. The goal is to identify competitive advantages and differentiate the firm advantages from those of its competitors.

Firm analysis

In conducting the firm analysis, we compare the same information as the competitors: VRIO, value chain, operating models, etc., to determine how the firm compares and competes strategically in the industries and markets it operates in. In this step, we also examine the organizational structures and identify strengths and weaknesses of the current operating and business models. The firm analysis also includes a structured and thorough analysis of the company’s financial situation, identifying key financial ratios and metrics, and their significance to the firm.

SECTIONS IN THIS CHAPTER

REFERENCES

  1.  Madsen, T. L., & Walker, G. (2015). Modern competitive strategy. McGraw Hill.

  2.  Porter, M. (1979). E.(1979). How competitive forces shape strategy. Harvard Business Review, 57(2), 137-145.

  3.  Barney, J. (1991). Firm resources and sustained competitive advantage. Journal of management, 17(1), 99-120.

  4.  Porter, M. E. (1985). Creating and sustaining superior performance. Competitive advantage, 167, 167-206.


Chapter 1.2: Gathering the Inputs - Market & Firm Analysis

Phase 2: Market & Firm Analysis

Phase 2 is the start of a thorough market and firm analysis. In phase 2 I identify the customers and segments, positioning and products, and examine the operational processes of the firm to make recommendations for improvement. Projects launched from these recommendations are often: 1) segmentation studies, 2) product satisfaction & usability studies, or 3) customer retention & engagement analyses. Much of this is done regularly in consumer packaged goods and other larger firms with higher levels of managerial sophistication. Bringing these frameworks together for software firms gives us an advantage over those firms that only loosely understand their customers and how to position themselves to their needs and provide the best products or services.

Phase 2 relies on classic marketing frameworks, “5Cs”, “STP”, and “4Ps” to provide scaffolding for the analysis and recommendations. The 5Cs are customer, context, competition, collaborators, and company. STP stands for segments, targeting, and positioning. The 4Ps, or marketing mix, are product, price, promotion, and place. Plenty has been written about these frameworks (Marketing Management (5e), Iacobucci, 2018) so I won’t go in-depth here but will talk about integrating them and my approach.

Exhibit 1: Visualization of phases.

Exhibit 1: Visualization of phases.

Exhibit 1 shows my flow through these frameworks. Note that I start with the customer, move to segmentation and positioning, then to the products for those customer segments before examining the competition, context, collaborators, and company. The choice of customer and customer need is core to the success of a company; without knowing what value you’re providing to whom, the rest of the analysis is moot. 

Customer

In my experience, many companies have either an ill-defined target customer or ill-defined understanding of their needs - often, it’s both. In the absence of these, identifying the target customer and unmet needs are the first projects that I kick-off. I work with the leadership team to articulate the key variables they believe make a good fit for their customer base. I then conduct a needs-finding study. This takes the form of jobs-to-be-done (JTBD) research. JTBD, or job theory, comes from the work of many innovation practitioners, most notably Clayton Christiansen.

While JTBD is relatively new to software companies, it is very similar to the goal-oriented interaction design practices first described by Alan Cooper, a thought leader in human-computer interaction, in his 1995 book About Face: The Essentials of Interaction Design, now in its fourth edition. This seminal work transformed how interaction designers approach problem-solving by starting with the user and unmet needs in the form of customer goals. Customers have tasks they do to accomplish those goals, and interaction designers look for ways to remove, reduce, or make those tasks easier. While examining the tasks is relevant to the product and design teams, from a business perspective we can use the jobs to help determine customer segments and opportunities to innovate or disrupt a market.

Segmentation, Targeting, & Positioning

In 2005 Tony Ulwick published What Customers Want: Using Outcome-Driven Innovation to Create Breakthrough Products and Services, introducing outcome-driven innovation (ODI), which adds an additional level of analysis by looking at what customers are hiring a product or service for, how important it is to get that job done, and how satisfied with getting it done they are. His form of gap analysis provides a way of articulating user needs and the biggest opportunities to solve.

In order to surface key underserved target markets, firms can combine the top-down approach of identifying key attributes of customers the firm would like to serve with a cluster analysis on the results of a JTBD survey. The approach can also help redefine an industry. While at Electronic Arts, and later Raptr, I conducted a form of this research that helped re-segment the gaming population. Game companies identified certain customers as ‘hard-core gamers’, a group generally comprised of young men who play skills-intensive games, such as first-person shooters, real-time strategy games, or MMOs. However, that articulation failed to see similar behaviors and goals in casual games players, leaving out a huge untapped market. Identifying similar behaviors among different groups, including their need to be the best at the game by spending time on forums and reverse-engineering the game mechanics, led to the identification of a new gamer segment we called the ‘avid gamer’, which in turn led to rethinking how we targeted and positioned our products to those markets.

We can use these segments to determine the market size and select the most valuable groups for whom to create solutions. Because we know what the jobs customers are hiring a product for, we can use the language discovered through JTBD research to position our products. With these data we can formulate hypotheses: We can position our current product for new audiences, we can improve our current products to better meet the needs of our target customers and, if we want to innovate, we can look for new underserved needs with large enough markets for which to build products.

Product

Of the 4Ps of the marketing mix, I first focus on product, leaving price, promotion, and place for another time. The product is the solution to the target customer needs, and the other elements of the marketing mix will rely on market and economic research best tackled in partnership with other teams in the organization. Products and services are what we offer to serve the needs of the segments we are targeting. When I go through this analysis, I tend to start with relatively straightforward approaches to understanding the product, then dig in deeper to uncover areas for improvement and ensure accountable ownership of the product across the product and service teams. The goal is to determine what to measure and provide a baseline. 

The first thing I look for is customer satisfaction (CSAT) measures to determine how well the product or service is meeting customer needs. There are many ways to determine CSAT, and I don’t intend to wade into the politics of satisfaction tools here. Any CSAT tool that provides a robust enough understanding of the customer’s perspective on your products or services is good. I combine the CSAT with a customer-only version of the JTBD analysis to get a sense of how well the product meets the needs of the targeted segments. 

I also look at more qualitative measures, such as usability findings, to determine the key pain points in the product or service experience. There are many user research tools for this, and much is written about it, so I won’t go into depth here. As part of this research, I look at the competition component of the 5Cs to understand what direction competitors are taking their products or services and start to get a sense of their strategic approach.

Finally, I work with data teams to identify key marketing, product, and service metrics, such as growth, engagement, retention, and feature adoption. Exhibit 2 shows an example of what types of metrics I look for in subscription-based companies with annual or monthly recurring revenue (ARR or MRR) as the core revenue metric. I’ve published a separate article on how to identify and use these metrics, drawing on the work of folks from Google and the Venture Capital community. I use this opportunity to identify the key marketing funnel metrics because I consider these all part of the product measurement process. The number of customers that make it from the marketing material into the product experience and become retained customers is an indication of product-market fit as well as effective targeting and positioning.

Exhibit 2: Cascading Metrics

Exhibit 2: Cascading Metrics

The result of phase 2 is the information necessary to lead teams to identify short and medium-term marketing, product, and service improvements and is often enough to fill product and marketing roadmaps for a year or more. At this point I work with teams to identify five possible areas for product roadmaps: 1) Quality of life improvements, 2) feature enhancements, 3) new product features, 4) new products, or 5) new business opportunities. At this stage, I use data collected from customer, market, and product research to provide recommendations for quality of life improvements, feature enhancements, and new product features, but leave new products and businesses for after phase 3.

Company

While the research efforts for the market and product are underway, I begin an analysis of the company. At this point, I assess the current practices and identify any opportunities for minor improvements; I will spend more time on operations and leadership later in the Bringing It All Together section. Exhibit 3 shows a business maturity model developed by Jeff Cobb and Celisa Steele of Tagoras that I consult to give a rough idea of the maturity of a business's leadership, culture, strategy, capacity, portfolio, and marketing practices. While every business has its own needs and approach to implementing, these elements serve as a guidepost for what mature practices look like to set expectations across the operating teams.

Exhibit 3: Business Maturity model

Exhibit 3: Business Maturity model

In phase 2, I also review basic financial information for the firm to get a picture of the health of the business and urgency for transformation. Revenue, growth, and runway are important to review. I look at the percentages of revenue for headcount for each division to get a sense of where the company invests. A software company may want to invest heavily in engineering, but those are expensive resources and overzealous investment can lead to spending the firm out of business instead of focusing resources on scope appropriate team sizes.

SECTIONS IN THIS CHAPTER

References

  1. Iacobucci, D. (2014). Marketing management. Cengage Learning.

  2. Christensen, C., & Raynor, M. (2013). The innovator's solution: Creating and sustaining successful growth. Harvard Business Review Press.

  3. Cooper, A., Reimann, R., & Cronin, D. (2007). About face 3: the essentials of interaction design. John Wiley & Sons.

  4. Ulwick, A. (2005). What customers want. McGraw-Hill Professional Publishing.

  5. Cobb, J. & Steele, C. Learning Business Maturity Model. https://www.tagoras.com/maturity-model/


From Data to Strategy

Who is this for?

You are a team, division, or business leader who recognizes you could be doing more with data and strategy to lead your teams to the outcomes you seek. You know there’s more to customer research than focus groups, more to business metrics than revenue, and more to understanding your employees’ experience than engagement surveys. And you know strategy is one of many tools in your toolbelt to help your organization stay focused, excited, and engaged in continuous improvement. You haven’t been able to connect the dots between the data insights you gather and the strategy you need. If this sounds like your experience, this series is for you. 

Learning to ground your strategy in data insights takes time and energy. Often, the steps will feel easy - a bit of homework, a sticky note exercise or two, some exciting debate over ideas, more workshops, and lots of presentations. As with any discipline--language, singing, martial arts--it only feels easy once you’ve practiced well and for a long time. I will lean on over two decades of experience with firms of many types and sizes, from Google to five-person fintech startups and from the U.S. Navy to international non-profit organizations. As reflected in the works referenced throughout this series, I draw from the fields of finance, strategy, marketing, statistics, psychology, organizational behavior, computer science, human-computer interaction design, and even acting, improvisation, filmmaking, and music. I don’t expect everyone to engage with every reference; they are here for your further exploration and to ground this series in the work of established thought leaders in these fields.

Chapter 1 is a deep dive into my own evolving approach to gathering the necessary inputs to develop effective strategies. Chapter 2 covers translating strategy into objectives for teams and delivering results through continuous discovery. Finally, Chapter 3 tackles engaging management and employees in the ongoing process of sharing, iterating on, and putting into practice the strategy the first two chapters guide you to develop.

The Strategy Discipline

Strategy is often one of the more challenging disciplines for organizational leaders. It’s difficult to prioritize the time away from day-to-day operations and ongoing projects to slow down and think deeply. There is always a fire to fight, an emergency to solve, or an important customer meeting to take. It’s overwhelming to think about making sense of the unending streams of data at our fingertips. However, if you are disciplined in your approach to strategy, you will prepare your mind and the minds of your employees to reduce the number of emergencies, to handle the fires with ease, and to make the data sing to a tune everyone can carry.

I view strategy as the hypothesis or set of hypotheses management believes will add value for the customer and to the business and I consider four inputs into the strategic planning process:

Input Owners Example data
Customer insights Design, CX, Product Needs analysis (jobs-to-be-done), behavioral analysis, interests trends, segmentation analysis
Industry/Market insights Marketing, Product, Engineering Porter’s Five Forces analysis, Industry trends, market sizing, country and global trends, technology trends
Competitive insights Marketing, Product Product comparative analysis, VRIO analysis, V-C analysis
Business insights Finance, Marketing, People Ops Vision & mission statement, brand assessment, financial reports & forecasting, budget requests, employee engagement analysis

That’s a lot of inputs. A common issue confronting many firms is how to incorporate all these insights into the corporate and product strategy process, especially customer research insights. Assuming you are generating customer insights, and methodological sophistication aside, there are two categories of customer data we need as inputs to strategy: how users behave (quantitative) and why they behave that way (qualitative). As a firm matures, the sophistication of the inputs improves. Financial inputs upgrade from basic cash flow analysis and forward-looking estimates to statistical modeling and forecasting. Customer insights move from simple customer interviews and surveys to observational research and behavioral data analysis.

Once we have the inputs available, we need a process to incorporate the inputs into our thinking, generate ideas, refine those ideas, and engage employees and customers in bringing the strategy to life. I typically aim for a 3-5 year strategy, yearly reviews and updates, and quarterly objectives and key results. I use a five-step approach that can take a day, or a week, depending on how much time the strategy team needs.

  1. Synthesize: Review in-depth analyses of the customer and business needs, market/industry context, and current business capabilities to prepare for generating ideas

  2. Generate: Ideation sessions in small groups, individually, and large groups to generate as many ideas for solving the customer needs as possible

  3. Refine: Select the ideas with the most potential impact for the customers and business

  4. Hypothesize: Articulate selected ideas into hypotheses that can be measured and tested

  5. Engage: Present the hypotheses in approachable language as strategic initiatives and engage management and individual contributors in creating execution plans

In the next several posts we will go deeper into each stage. Next up is a strategy and operations playbook: a deep dive into gathering the inputs and putting them to use.

Coming soon: